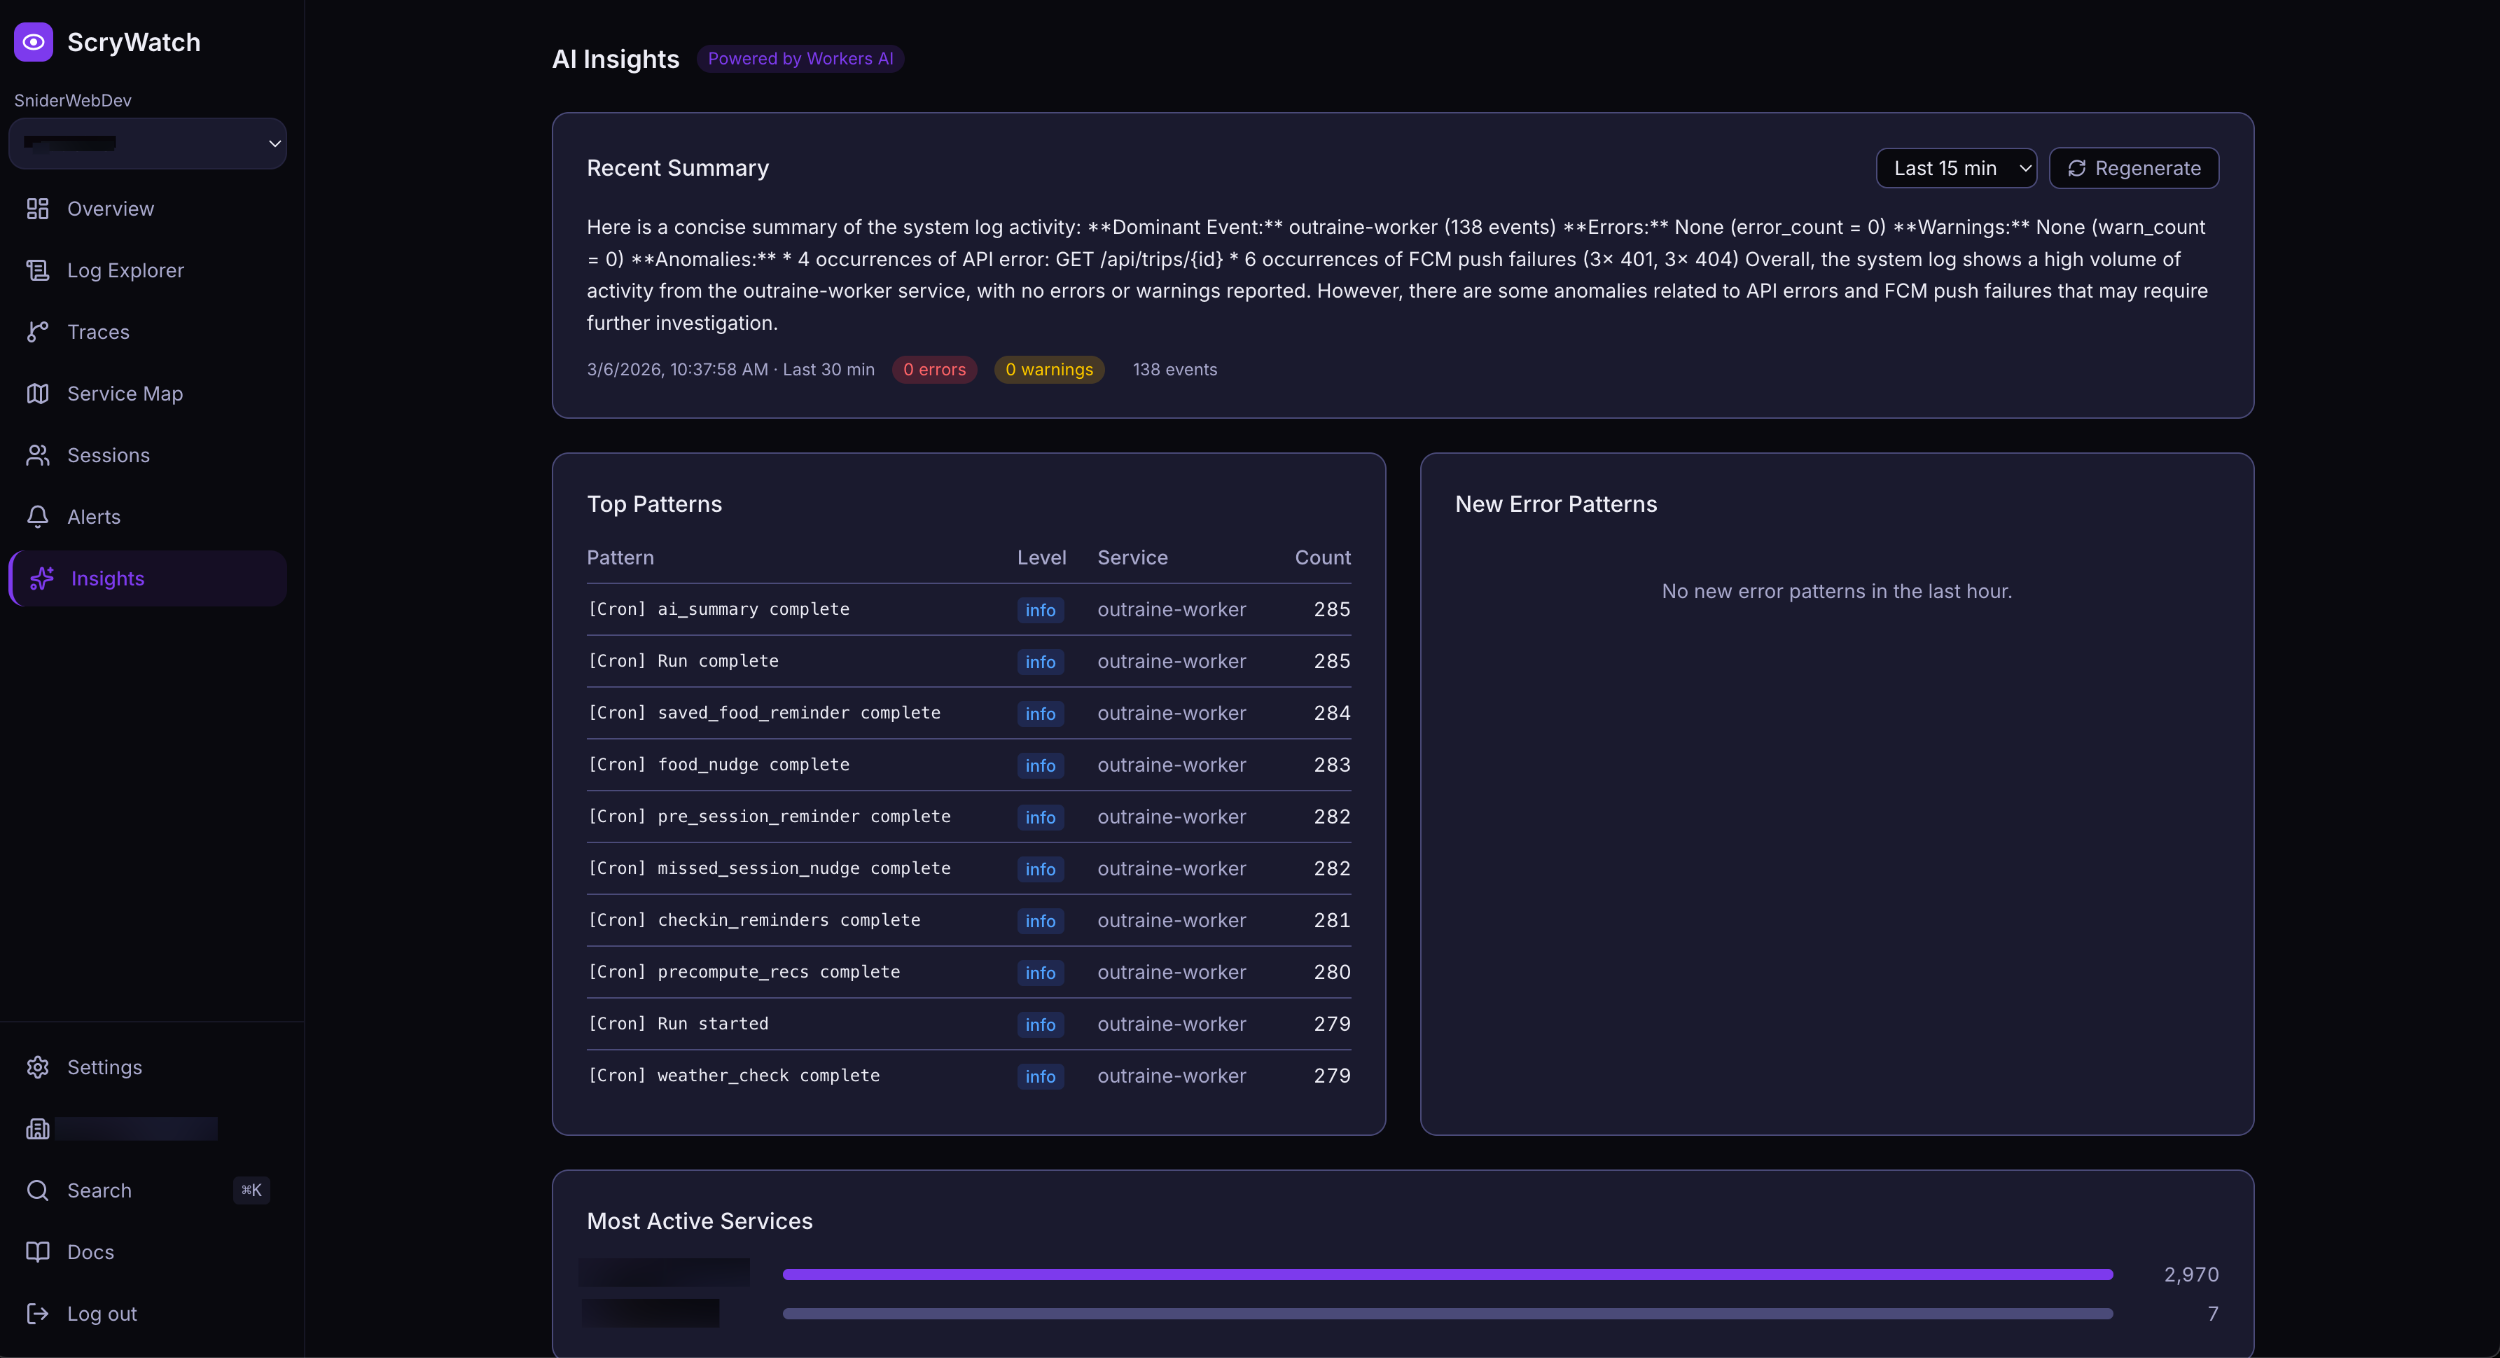
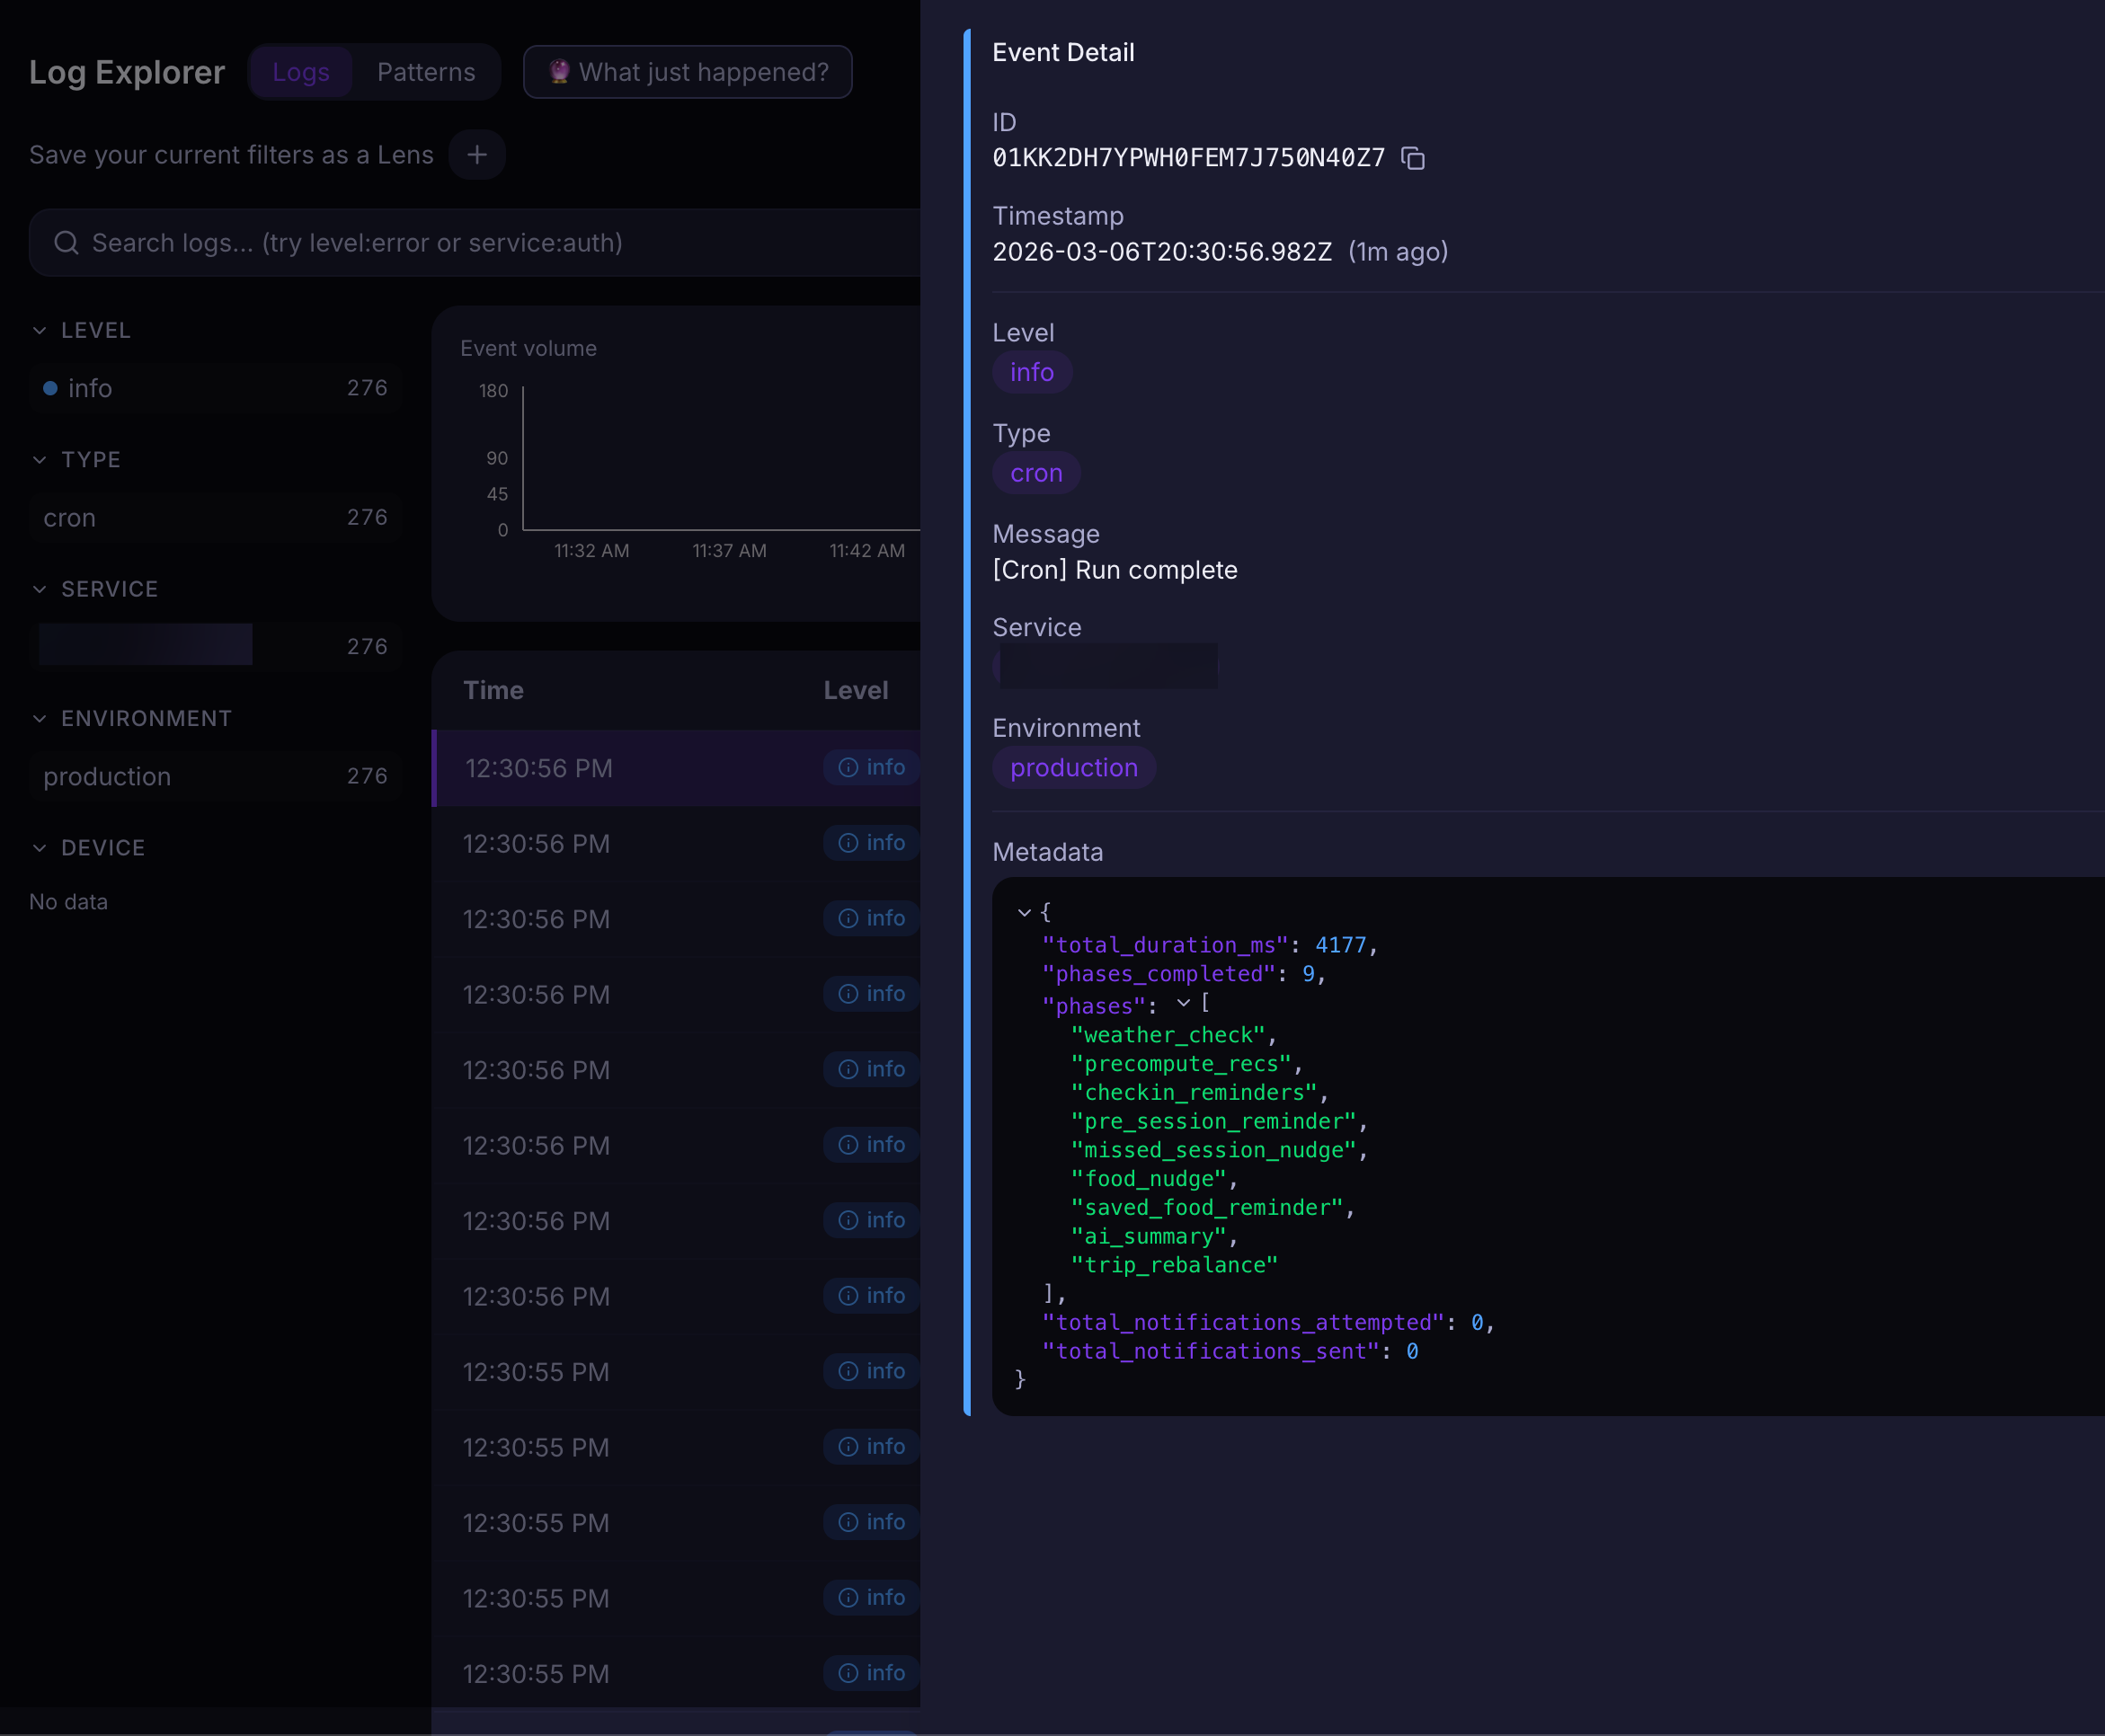
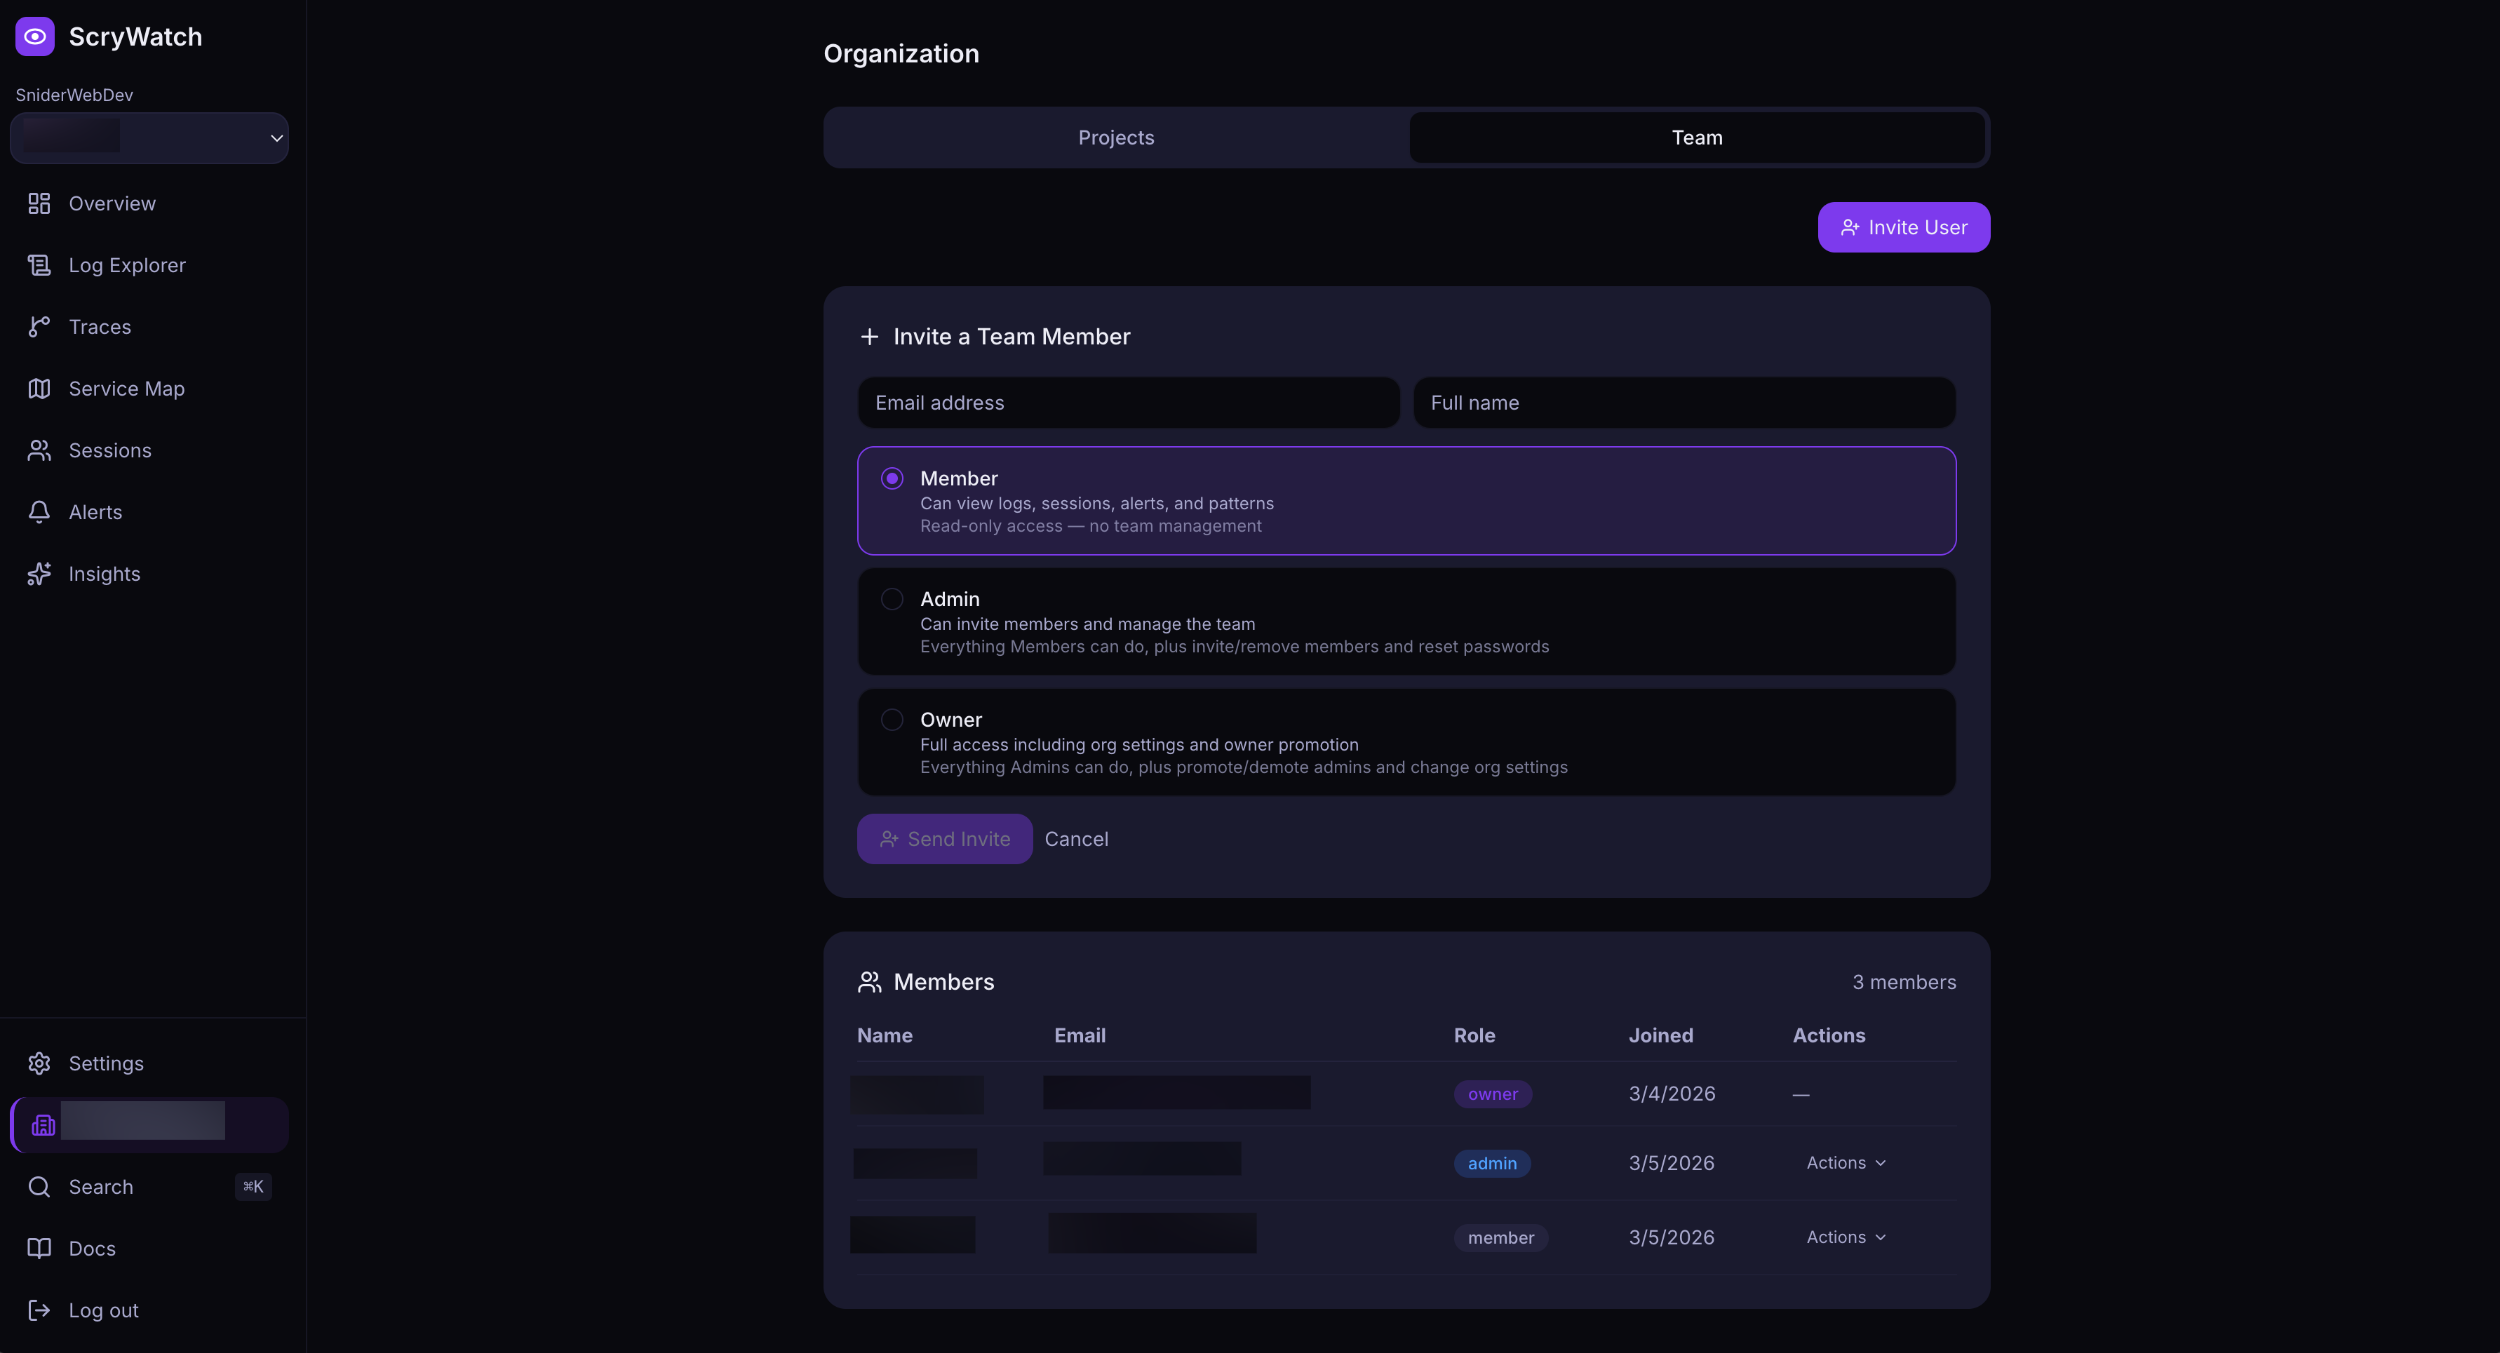
ScryWatch runs on Cloudflare Workers, D1, and R2 — the same stack you're already on. Ingest logs, trace requests, detect patterns, and get alerted in real time. From $12/month, no bloated enterprise bill required.
| Datadog | ELK Stack | Loki | ScryWatch | |
|---|---|---|---|---|
| Setup time | Hours | Days | DIY | 5 minutes |
| Cost | $$$+ | Self-hosted | Self-hosted | From $12/mo |
| Cold starts | Yes | Yes | Yes | Never |
| Cloudflare-native | No | No | No | Yes ✓ |
ScryWatch is opinionated about what a dev team actually needs — and leaves out the enterprise bloat.
Already on Cloudflare Workers or Pages? ScryWatch adds zero new vendors. One account, one bill.
Tail-based APM with full waterfall view. Send spans via our JSON API or any OpenTelemetry-compatible SDK.
Automatically normalizes log noise into recurring patterns stored persistently in D1. New error patterns are detected and surfaced automatically so you can spot emerging issues before they escalate.
Filter by level, service, environment, and device type. Adaptive time histograms show exactly when spikes happen.
Real-time WebSocket log stream. Watch events arrive as they happen — no refresh required.
Set thresholds on any field. Get notified by webhook or email with configurable cooldown periods.
Mobile-first session timelines with error, warn, and crash breakdown. Drill into any session to see the exact event sequence.
Logs older than 24h are automatically compressed and written to R2. Browse months of history from the dashboard — no extra infrastructure, no data loss.
Invite your team with role-based access. Owners, admins, and members — each with the right permissions.
Ask 'What just happened?' and get a plain-English summary of recent log activity, powered by Workers AI. No dashboards to configure — just click.
Built on infrastructure you already trust.
"Everything runs on Cloudflare's global network — your logs never leave the edge, and there's no separate analytics infrastructure to operate."
Send a JSON log event to ScryWatch via any HTTP client. No agents. No SDKs to install. No schema to define. Your logs appear in the dashboard in under a second.
export default {
async fetch(request, env, ctx) {
// Send log without blocking the response
ctx.waitUntil(
fetch('https://api.scrywatch.com/api/logs', {
method: 'POST',
headers: {
'Authorization': `Bearer ${env.SCRYWATCH_API_KEY}`,
'Content-Type': 'application/json',
},
body: JSON.stringify({
level: 'info',
message: 'Request handled',
service: 'my-worker',
path: new URL(request.url).pathname,
status: 200,
}),
})
);
return new Response('OK');
},
} ; Logs appear in your dashboard in <1 second. No SDK required — any HTTP client works.
From a single log line to a full distributed trace — ScryWatch shows you the full picture.
See everything. Filter instantly.
Live tail, faceted search, time histograms, and pattern detection — all in one view. Jump straight to a trace from any log line.
AI that actually reads your logs.
Powered by Workers AI — get a plain-English summary of what's happening, top patterns, and newly surfaced error types.
Rich event detail.
Click any log to inspect structured metadata, timestamps, and linked traces.
Get notified before your users do.
Threshold alerts on any log field, delivered by webhook or email with configurable cooldowns.
Built for teams.
Invite members with fine-grained roles — Member, Admin, or Owner — across all your projects.
Start free. Scale when you need it. Paid plans allow soft overage at $2 per additional 1M logs.
* All logs are archived to cold storage indefinitely. The query window controls how far back you can search from the dashboard.
Have a question or want to learn more? Send us a message.